FEATURED 3D METHOD: 3D LASER SCANNING IN 3D DOCUMENTATION AND DIGITAL RECONSTRUCTION OF CULTURAL HERITAGE
by Annemarie La Pensée, Conservation Technologies, National Museums Liverpool, UK.
Keywords: 3D visualisation, non-contact recording, laser scanning, documentation, digital reconstruction, cultural heritage, Mesolithic fish traps, medieval sculpture.
Introduction
Recent advances in non-contact 3D capture technology have made it possible to digitise cultural heritage in three dimensions. Laser scanning is just one method of many which can provide a 3D data set of the topography of an object. The data obtained by 3D recording methods can be used in visualisations, and this ability to present a 3D image of a cultural artefact has many advantages. However, an object on a computer or 3D screen is only valuable if we either cannot access the original object, or if we are gaining different information from that which we can obtain from interaction with the real artefact. Examples of such additional information include:
- Impractical views or views of an object that are impossible in the real world;
- The ability to image a subset of visual information for an object, which in some cases has revealed features on a surface.1
- The ability to digitally reconstruct missing sections, or lost colour on an object, without risk to the artefact.
- Using virtual environments, cultural heritage can be examined in potential historical contexts. Such reconstructions are not without their limitations and one can easily imagine a situation which, in the worst case, can lead to a misinterpretation of the original object.
This paper describes how 3D data of cultural objects can be obtained by laser scanning and how these data have been used in 3D visualisations in the documentation of some Mesolithic fish traps; the display of a piece of rock art; and the colour reconstruction of a twice life-size medieval sandstone sculpture of St Christopher.
Equipment
Several universities and cultural institutions have developed specialist 3D surveying equipment for certain special documentation projects, while others have chosen to use what is available on the market. More commercial companies are now orientating sections of their business and products towards the heritage market. However, it is unlikely that in the immediate future the revenue from this sector will be sufficient to drive the technology forward in a way that addresses the specific needs of the heritage field. This is in part due to the huge variety of artefacts that can be classed as heritage objects and may need to be recorded. From coins, jewellery, to life size sculpture and buildings, textiles, paintings, organic matter, plastic, stone, wood and metal, the range of dimensions and materials is almost daunting. In addition, documentation of some objects demands that colour information is also recorded, while in other cases it is sufficient or actually advantageous to only obtain surface information. It is clear that a wide variety of techniques and different approaches are required to accurately and usefully document our cultural heritage in 3D. Laser scanning offers just one way in which the 3D surfaces of objects can be recorded. Pioneered in the automotive and aeronautical industries, this technology has found its way into heritage because of its high accuracy and resolution. Moreover, it is a non-contact technique an essential pre-requisite when recording cultural heritage.
Broadly, laser scanning systems can be divided into two categories: close-range and long-range systems. Long-range scanners have a capture envelope ranging from several metres to kilometres and include phase shift and time-of-flight scanners. Typically, long-range systems have an accuracy of several millimetres or more, and are used in heritage for the recording of large facades, entire buildings and large archaeological sites and features. Short-range systems are used for the capture of objects that range in size from a few millimetres to several meters, and typically have the accuracy in the sub-millimetre range. Triangulation-based laser scanners are the most common form of sensor utilised in this category, and alongside fringe projection systems, are able to provide the most accurate data sets. A triangulation-based laser scanner projects a thin stripe or spot of low-power laser light onto the surface of the object to be scanned
(Fig. 1).
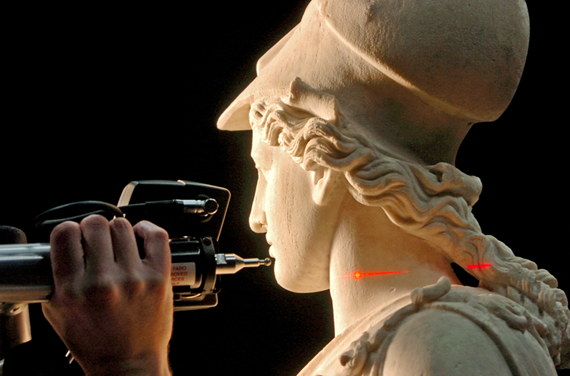
Fig. 1. 3D recording using non-contact laser scanning. © Conservation Technologies, National Museums Liverpool. Reproduced with kind permission.
The reflected light is recorded by an off-axis digital video camera. The distance between the laser emitter and the detector is fixed and known, and so is the angle at which the light leaves the laser emitter. As the angle at which the light arrives back at the sensor is being measured, by basic trigonometry, points on the surface are recorded. The resulting data is a set of, typically, many millions of points, each one a measurement from the surface; this raw data set is termed a 'point cloud'. The point data sets are generally converted into polygon mesh surfaces using specialist software packages. This is because a polygon model of a surface allows easy visualisation of the surface compared with a point cloud. The polygonal surface can be lit from any angle, and colours and textures can be readily applied.
The 3D Documentation of Mesolithic Fish Trap Remains
During an excavation by Archaeological Consultancy Services Ltd in 2006, of a site close to the hill of Tara, Dublin, Ireland, several late Mesolithic (middle stone age) fish traps were unearthed. Fish traps in the Mesolithic were constructed of reeds and rushes woven together. They were conical in shape with a wide circular circumference at the entrance where the fish swam in, narrowing to a point at the other end where the fish would be caught. The fish traps, one of which is shown in Fig. 2, have been flattened, but well preserved in a peat bog. These finds are extremely fragile, especially once they have been removed from the ground.
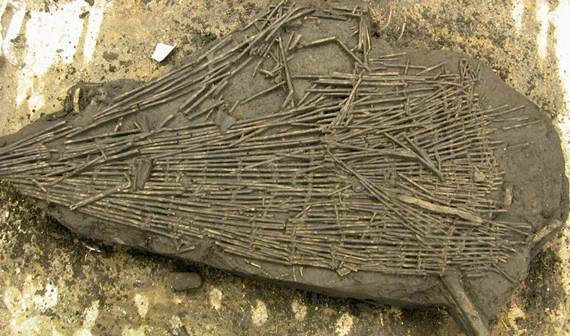
Fig. 2. A Mesolithic fish trap. © National Museums Liverpool. Reproduced with kind permission.
The archaeologists were interested in recording these finds as part of the conservation of the fish traps. Any recording method would need to be highly accurate and be completed in a short time frame, to limit the degradation of the finds before recording was complete. Due to the complex geometry, hand drawing would in this case probably not provide an accurate document, and certainly the time involved would be prohibitive. Although flattened, the objects still retain a great deal of 3D geometry that the archaeologists were not satisfied could be sufficiently documented using 2D photography. Photogrammetry, although fast, is not best suited to complex geometric shapes such as these. The fish trap remains were scanned on site soon after excavation to produce highly accurate 3D digital records. A ModelMakerX triangulation laser scanner using a sensor with a 70mm stripe width mounted on a 7 axis Faro gold arm was used during data capture. Nineteen pieces, including full baskets and several fragments, were recorded in 3D to an accuracy of +/- 0.1mm. To scan a fish trap measuring 550mm x 1100mm x 140mm took four hours and the resulting raw data set comprised approximately 52 million points. The complexity of the surface being recorded is a large factor in determining the time this process takes. A less detailed surface allows the operator to move the scanner over the surface more quickly (less measurement points will be required) compared to a detailed area of the object (where more data points are required to model the surface accurately); here the operator has to move the scanner over the surface much more slowly. Once scanning was complete, the point clouds for each find recorded were converted into 3D polygonal meshes. Specialist software (in this case Polyworks by InnovMetric Inc.) was used to align the data sets and to merge the points into a coherent 3D polygon model. At this point in the process, tolerance-based reduction (known as 'decimation') was applied to the model. Areas of low detail can be made up from fewer larger polygons than areas of high detail, which require a denser mesh to define. In this way the overall file size can be reduced, although care must be taken not to lose resolution or detail by over 'decimation' of the data. The polygon model was also 'cleaned'. 'Unclean' polygons (triangles), such as those that are inverted or are crossing one another, can arise during the complex calculations performed by software during the meshing process. 'Unclean' areas of data can also arise when scanning dark or shiny areas of a surface that absorb the laser beam, or reflect it specularly. This was a particular problem in the case of the fish traps as they
had to be regularly sprayed with water to prevent deterioration caused by them drying out. The post-processing of the trap took twelve hours and a screenshot of the final 3D data set is shown in Fig. 3.
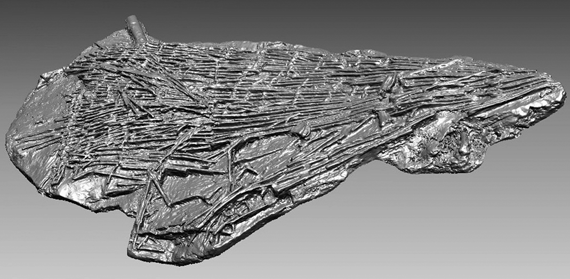
Fig. 3. A screenshot of the 3D digital model of a Mesolithic fish trap. © Conservation Technologies, National Museums Liverpool. Reproduced with kind permission.
This final model comprised 6.6 million polygons, and can be rotated, zoomed, measurements taken and examined on screen in three dimensions using specialist software. Such software can be downloaded for free, albeit with limited functionality, from the web.2 Through these computer models, the nineteen fragments and fish traps can now be studied without any risk to the objects themselves and importantly, archived for future generations.
The 3D Documentation and Visualisation of the Heygate Stone
The Megalithic stone unearthed accidentally in Heygate, West Yorkshire in 2001 (Fig. 4) is now on permanent display at Bracken Hall Countryside Centre near Bradford. The stone, approximately 584mm x 276mm x 546mm in size, has distinctive cup and ring marks on one face, and is thought originally to have been part of a larger collection of stones. Prior to the stone going on display, National Museums Liverpool were asked to make a complete record of the surface using 3D laser scanning. The Heygate stone was scanned at the Manor House Museum, part of Bradford Museums, Galleries and Heritage. The non-contact recording of the stone took 1.5 hours and the resulting point cloud contained approx. 12 million points. In this case, post processing of raw data involved, in addition to 'decimation' and 'cleaning', localised hole filling. Holes are caused by obstructions in the path of the laser light during the recording process. The resulting 3D model comprised approx. 3 million polygons (Fig. 5).
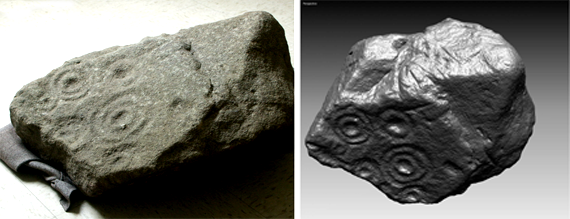
Fig. 4. The Heygate stone. © National Museums Liverpool and Bradford Museums, Galleries and Heritage. Fig. 5. A screenshot of the 3D digital model of the Heygate stone. To download a movie (5.87MB wmv file) click the image. © Conservation Technologies, National Museums Liverpool. Reproduced with kind permission.
It has been shown that when looking at rock art the patterns can often be better determined in 3D scan data because the eye is not confused by the colour information on the surface of the object. This was found to be the case when looking at the Heygate stone. The enhanced legibility that the 3D model provides was used to expand the visitor experience during a temporary exhibition at the Manor House Museum, Ilkley. A flythrough, created in 3D StudioMax software (Discreet), in which the 3D model was rotated for the viewer, thereby lighting different parts of the stone selectively, demonstrated the enhanced legibility of the patterns. As a result of this, Gavin Edwards, Museum Officer (Archaeology), identified a further advantage of employing a rotating image of any carved rock. The rotating 3D image prevents the viewer from thinking that there is a right and wrong way to look at the carving. There is no 'top' or 'bottom', in contrast to looking at a 2D image on a page, which tends to make people think that there is only one way, or even a correct way to observe the rock.3 There is another advantage of recording rock art using accurate 3D techniques. If permanent fixed markers are in place on or around the rock, repeat recording may be used to monitor surface loss or weathering. Monitoring the changes in the condition of an object is helpful in making an informed decision about its conservation treatment.
The Sculpture of St Christopher at Norton Priory, Cheshire
A twice life-size medieval statue of St Christopher (Fig. 6) stands at Norton Priory, Runcorn, Cheshire. The sculpture is carved in local sandstone and dated stylistically to the late 14th century. The work is one of the few remaining British examples of colossal religious figurative sculpture, and remains in outstanding condition despite the upheavals of the 16th and 17th centuries. St Christopher is depicted in medieval dress, carrying the child Christ through a fish-filled river. With one exception, these representations of fish are anatomically correct for species found locally in the river Mersey. It is likely that St Christopher was used as an icon for the many travellers who crossed the river near the priory. The head of the Christ child was removed from the sculpture at the time of the Reformation but was later replaced during the reign of Charles II. It is thought that the missing staff was carved of wood.4
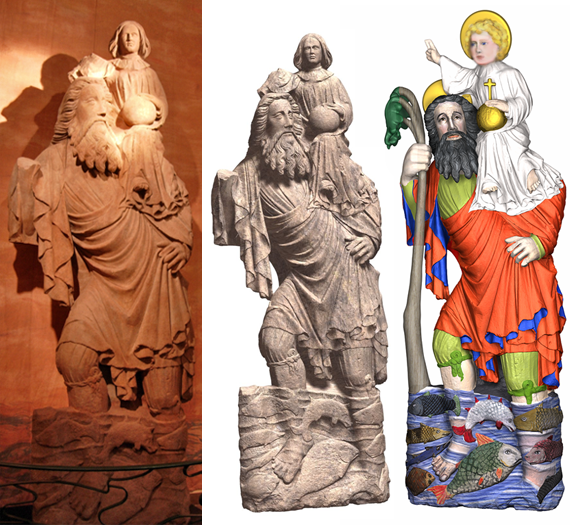
Fig. 6. The St Christopher sculpture, Norton Priory, Cheshire. Fig. 7. A screenshot of the 3D digital model of St Christopher before reconstruction (stone texture applied). Fig. 8. A screenshot of the 3D reconstruction. © Conservation Technologies, National Museums Liverpool. Reproduced with kind permission.
Development of a New Interactive Gallery at Norton Priory
When Norton Priory re-developed the gallery which houses St Christopher in 2005-6 curators were interested in a novel interpretation of the sculpture. In particular, there was the desire to reconstruct the colours the work may have been painted originally and make this decoration an integral part of the visitor experience. The intention was to show the changes in colour scheme over time, and it was felt that a 2D image would not be as flexible or informative as a 3D representation. Curators also wanted to digitally recreate a more stylistically accurate Christ head and replace the missing fragments, such as the wooden staff. The desire to allow the visitor to interact as fully with the virtual sculpture as possible, while demonstrating the reconstruction process, led to the development of a haptic (touch) interactive display system for the gallery.
Non-contact Recording of the Sculpture
First, a 3D record of the sculpture was created. All other elements of the interpretation were then developed from this data set. It was decided that for a sculpture of this size the smallest level of detail to accurately record should be approx. 2.5mm. Again the ModelMakerX scanner was used although with a 140 mm stripe width. The scanner is on an arm containing locating sensors. So long as one does not move the base of the scanner or the object during scanning, the position of all data in space is correct. Understandably on a large object like this the scanner does have to be moved around the object. The data sets resulting from the different scanning 'stations' require registration, alignment and merging to create a coherent 3D model.
The scanning took 32 hours in total and around 150 million points were recorded. Particular care was taken to record common reference points in all stations to allow accurate registration of the data sets. The post-processing of this large data set took 127 hours and the final model comprised approx. 7 million polygons. Much more data have been recorded than it was possible to process with the computing power available (i.e. several good PCs). A model that utilised every point recorded could not be produced even if discounting redundant data, i.e. data acquired by passing over the same part of the surface twice or, several times, such as in areas used for registration. However, it was important to record the sculpture at this resolution and accuracy, as not only it is a 3D record of this important work, but in addition to the complete model, small areas of the model were also processed at higher resolution. For example, replicas of the head of St Christopher for a gallery in Liverpool, and an interactive touch display of the imaginary fish for the gallery at Norton Priory, were also produced.
Digital Reconstruction of Missing Fragments
The haptic system through the FreeForm software (SensAble Technologies) was used for the digital reconstruction of missing fragments of the sculpture. The software operates with a force feedback system that allows the operator to interact with the 3D model by means of a hand held stylus. The operator uses the stylus to manipulate virtual modelling tool on screen. When the virtual tool comes into 'contact' with the 3D model, the user is able to 'feel' the surface of the model. The tool may also be used to add or remove virtual material, and thus changes in the surface geometry can be created. This is an intuitive manner of working analogous to a sculptor working with a clay model. The Christs head and the staff were digitally reconstructed using the haptic FreeForm system.
Colour Reconstruction
The colour reconstruction was based on a watercolour drawing by a conservator, John Larson. His basis was the colour information determined from the polychrome fragments found on the sculpture when it was undergoing conservation treatment. Additional information came from historical research and comparisons with other depictions of medieval saints.5 The 3D digital model of St Christopher was scaled in size to 1/15th of the original. This was to ensure that any images used were not overly stretched, reducing the quality of the final textures. This scaled - down file was cut into sections according to areas of corresponding colour, identified from the artist's impression. The files were then separated into two types: those which were to be hand painted, such as St Christopher's gown, and those which were to be created digitally. Stencils were created for those that needed painting by hand by taking a screenshot of the relevant section viewed from its flattest angle. This image was printed onto paper, hand painted and then 2D scanned into 3D StudioMax and used as the texture map. Once the textures had been mapped onto the model, they were blended to allow the colours to fade with the progression of the time line depicting St Christopher from the 1390s to the present day (Fig. 7). The film clip with the full colour and digital reconstruction is on display next to the sculpture. Elements of the 3D digital model are available at a kiosk with an interactive, haptic display for the visitor to examine the sculpture further. This interactive also tells the story of St Christopher.
Data Storage
It is crucial that the data produced in the 3D digital documentation of heritage objects is archived for the future. This technology is not widespread and the rapidly changing nature of the hardware means that there is, as yet, no standard method of archiving and storing the 3D data produced in the heritage field. There are still many problems, such as data obsolescence, media deterioration and the controlled access to 3D products for multiple users. These issues are only beginning to be addressed by projects such as the Big Data Project and by the Digital Curation Centre.6
National Museums Liverpool are responsible for a large collection and it is essential that this responsibility is extended to the rapidly expanding digital collection. The future of the digital data needs to be safeguarded whilst enabling as wide access as possible. All raw and processed data resulting from scanning and digital reconstruction are currently stored on CDs in two different locations under museum security, one copy in a fire proof safe. Metadata files which detail how the data were collected and how they have been processed are also stored alongside each set of project files. The raw data are stored in the scanner's own format rather than the non-proprietary ASCII format. The ASCII format has the advantage of protecting the files from becoming obsolete, but has the disadvantage that information recorded by the scanner with each point is lost. The intention is to deal with the issues of file obsolescence when they arise by converting to newer file formats when necessary. This is in no way a trivial task, and steps are being taken to implement a specialised system as soon as possible. The completed data sets are stored as STL files - a machine readable file format. STL stands for 'steroelithography' which is the type of rapid prototyping technique, for which the file format was originally designed. To counteract the effects of material disintegration of the storage media, the CDs are kept in conditions with controlled temperature and humidity; to protect the dye layer, writing or sticking labels is not allowed on the CDs. In addition, we are about to load all data onto a secure server and aim to address the lack of access to this resource in the near future.
Conclusions
Data obtained by non-contact 3D recording have many varied uses in the 3D visualisation of cultural heritage. It is a powerful tool even in its most basic visual form as a 3D data set represented on a 2D screen. 3D records of heritage objects provide greater scholarly and public access to the information held within our cultural heritage. Moreover, advanced reconstructions and animations are readily created from 3D data sets. Visualisations can be produced to include colour and missing fragments of artefacts, as well as providing historical environments and contexts. The increasingly large demand for better access to much of our cultural heritage could become detrimental to some of the most important works. 3D visualisation may help to provide an immediacy that has to be lost to protect the original, as well as providing invaluable interpretative tools for museum displays and educational facilitators. It is crucial that an accurate record of the decision making process involved in any reconstruction is kept and is accessible in the future.7 The difficulties that 3D visualisations present are well documented.8 In particular, there is the fear that 3D visualisations are perceived as in some way more real ' than a 2D representation or description. In fact, both 2D and 3D representations are impressions of what might have been, and both are therefore entirety subjective. Just because digital visualisation can be animated and increasingly begins to look like the world around us does not, in any way, validate the information it contains. I would venture that the perceived credibility attached by some to 3D reconstructions will quickly lose its relevance. As new generations grow up with 3D virtual representations so they will instinctively apply the same scepticism that we bear in mind when looking at a photograph or reading an eye witness testimony from history. It will be common language how these representations have been created and hence the subjectivity of their creators will be taken into account.
Acknowledgements
All projects:
National Museums Liverpool, Conservation Technologies. For more information see
3D Recording. Case Studies.
Public Sector Research Exploitation Fund (PSRE).
Mesolithic Fish Traps Project: Archaeological Consultancy Services Ltd. Ireland.
Heygate Stone Project: Ilkley Manor House Museum and the Bracken Hall Countryside Centre, City of Bradford Metropolitan District Council.
Norton Priory St Christopher Project: Norton Priory, National Museums Liverpool.
Vertalis LLC
National Endowment for Science, Technology and the Arts (NESTA).
Notes:
1. See for example, Eklund, J. and Fowles, P. (2003), 'Three-dimensional recording by laser scanning of the petroglyphs at Rombald's Moor, West Yorkshire', Conservation and Management of Archaeological Sites, 6, pp. 11-22.
2. For example, Rapidform Basis.
3. Comments from Gavin Edwards, Museum Office (Archaeology), Manor House Museums, Ilkley, Bradford MDC.
4.
Marrow, D. J., 'The statue of St Christopher from Norton Priory', Excavations at Norton Priory 1970-87, edited by Brown, F. and Howard-Davis, C., forthcoming .
5. Including much smaller (approx. 0.4 to 1.0m tall) medieval alabasters in the collection of the Victoria and Albert Museum; a wall painting at the parish church at Pickering, North Yorkshire, and a coloured German woodcut print of 1423, known as Buxheim St Christopher, in the John Rylands University Library of Manchester.
6. Austin, T. and Mitcham, J. (2007), Preservation and Management Strategies for Exceptionally Large Data Formats: 'Big Data', A Report published by the Archaeology Data Service and English Heritage. See also the Digital Curation Centre website. The report by David Holdsworth (2007), Preservation Strategies for Digital Libraries, Ross, S. and Day, M. (eds), is limited in its coverage of 3D data yet indicative of future developments.
7. These issues are addressed by The London Charter. See also, Fernie, K. and Richards, J.D. (eds.), (2002), Creating and Using Virtual Reality: a Guide for the Arts and Humanities, AHDS Guides to Good Practice, with contributions by Tony Austin, Rachael Beach, Aaron Bergstrom, Sally Exon, Marc Fabri, Michael Gerhard, Catherine Grout, Stuart Jeffrey, Mike Pringle, Damian Robinson, Nick Ryan, Melissa Terras and additional case studies by Kate Allen, Clive Fencott, Learning Sites, Anthony McCall.
8. [Editorial note] See 3DVisA Discussion Forum, 3DVisA Bulletin, Issues 1 (September 2006) - 4 (March 2008).
© Annemarie La Pensée, Conservation Technologies, National Museums Liverpool and 3DVisA, 2008.
Back to contents