| JISC 3D Visualisation in the Arts Network 3DVisA Bulletin, Issue 1, September 2006 ISSN 1751-8962 (Print)
ISSN 1751-8970 (Online) FEATURED 3D METHOD: The Artist Christian Nold talks to Anna Bentkowska-Kafel about BioMapping Keywords: BioMapping, Christian Nold, biometrics, participation, 3D visualisation. You ask people to take their emotions out for a 3D walk. Can you explain?
BioMapping is a participatory methodology for people to talk about their immediate environment, locality and communal space. I'm trying to use 3D visualisation as a way of talking about the space. It's not representational. As part of this method I have developed a device, which can be used by lots of people. It consists of a lie detector connected to a GPS (Global Positioning System) unit, which measures your location and your physiological arousal at the same time. By combining the two I can talk about the physiological arousal in certain locations. A Galvanic Skin Response sensor in the form of finger cuffs measures the sweat level. Fitted out with this device, people go for a walk and when they return their data are visualised and annotated.
How?
By downloading data onto a laptop data are transformed by my own software and then projected onto Google Earth. The Galvanic Skin Response unit measures the amount of skin conductivity. I'm suggesting that a change in skin conductivity not only tells something about your body, but also suggests an emotive event. I'm plotting the amount of change in the skin resistance level versus location. There are various technical transformations and averaging I have to do to the data. I'm sampling once every four seconds, because I found this optimal for this kind of spatial representation.
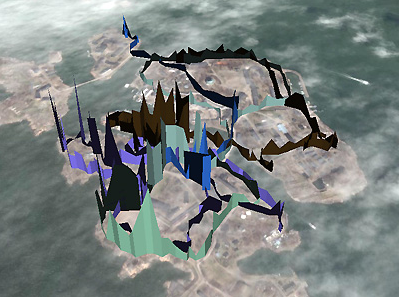
Fig. 1. Suomenlinna, Finland. Emotion Map: Six participants. Image © The GeoInformation Group 2006.
You then visualise data and assign colours to specific emotions or the whole walk.
There are two kinds of visualisations. In the older visualisation I used a colour scale from green to red; green being a low arousal, i.e. a calm area, and red being a high arousal. It was dot-based and 2D, and built it in Macromedia Director. Now, using Google Earth I visualise height as indicator of arousal and use different colours for different walks. The biomap of a walk that took place in Nottingham as part of Digital Cultures 2005, shows a route of emotional picks. You've marked them in red. What was so special about this route to make people so emotional?
That's a question I ask people, it's not something I can answer. If you look at people's annotations, they were talking about seeing people they recognised; being asked by tourists to take photographs of them; going to shops; it's a whole variety of different things. It's very much about what people are saying about their own reactions.
How valid are these annotations? Do people make up these stories?
I don't thing there is any 'truth' or 'lies' in these stories. People are generating the content. They are the final arbiter of the contents. When someone does a drawing you don't ask whether this is a 'true' drawing or not. We can see these documents as a record of their experience. I see the combination of scientific data and the annotations as being one package that shows how people have interpreted their experience.
The interpretation is as important as the actual mapping, isn't?
It's the same thing. The visualisation of the data only allows that discussion to take place. So the end product is the combination of this concious reflection on the 'pseudo'-scientific data.
Tell me more about the community workshops you organised in Greenwich from October 2005 to March 2006. I believe one local MP in particular was not very keen on your mapping of residents' emotional responses to the huge regeneration programme this part of London is undergoing at present?
We had the MP and all the redevelopers all happily shaking hands. On the outside there was certainly no animosity between them, but underneath there's lots of conflicts. The conflict is always between the developers and the local MPs, being the local political structures, because they are two different powers being wielded.
How did your experiment reflect the residents' reactions?
Oh, that's a really big question. What was interesting was that the MP was really excited because he could see that there was some real politics happening there. He felt he didn't have anything to do with it, and he somehow felt excluded. So he saw politics happening and wanted to be part of it. This is interesting because for the next stage of BioMapping I want to work with some of these 'stakeholders', as they're called, and try to work through some of these ideas. What this map means and how it can 'start' being used? I think there will be a lot of discussion about representation; the kind of questions you're asking: How representative this is? Does this represent all the people's opinions? I personally don't see the map being 'representative' but more as a discussion tool to argue a point.
This is how maps have always been used.
Yes, but I want to get away from representational maps towards discourse maps or, as I call them, 'weak' maps rather than authoritative maps.
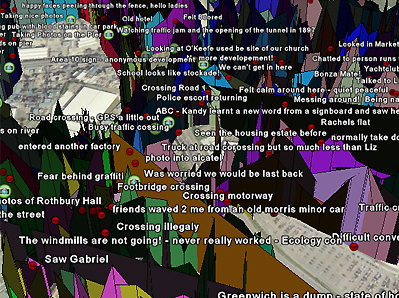
Fig. 2. Detail of Greenwich Emotion Map. Image © The GeoInformation Group 2006.
Two annotations that I remember are 'realising to be running late and crossing the Italian style', and another one noting the Millennium Dome renamed as O2 Area.
Those annotations are done after the event. People comment about the space or about the experience, such as commenting on 'crossing the road Italian style', or trying to think what happens when they 'peak'. Sometimes I ask people to think about their walk and then show them the map. It allows people to remember things they would not otherwise think about. There are many things we forget about when we go for a walk, so many things simply get lost. This is a way of looking at minutia of our experience. Some people say this is a kind of paranoia or schizophrenia technology. It makes us constantly reflect on our experience, constantly makes us aware of ourselves.
Is BioMapping a reaction to the ubiquitous presence of security cameras?
Sure. If you think about surveillance technology, CCTV cameras are a very visual example of that.
Do you think you give people back the control over their actions and memories? They can switch the device on and off, can't they?
No, they can't. I have the key! There is something very performative about BioMapping. People are taking part in an ambiguous performance when they are using the device. I like the idea of performative technology that make the user concious of the technologies they are using.
On the one hand it's about participation, but on the other it's about you controlling what they do. Are you directing the performance?
Yes, it's a performance where I'm directing their life in a particular way. I'm asking them to think about the political and social implications of this technology and how it could or should be used on a larger scale. We constantly perform for CCTV cameras every day.
Do you tell people where to go?
No, they can go where they like. But I sometimes tell people it might be worth thinking about where they want to go beforehand. Sometimes people go to re-explore where they go for a walk everyday; sometimes people take their normal walk to work; sometimes people go to places they really love. It's quite interesting when people have an agenda.
Do people improvise?
People try to mess around with my device, which is interesting. People are playing with it: trying to jump out at each other or into a pool of water. People see there is this issue of control and are trying to deal with it. BioMapping is not a way of telling people about their emotions. If you think about Foucault, the body is the place where all control is exercised. The body is politically controlled through physical means, but also through our imaginations, emotions, fantasies, ideas of desire. BioMapping is a way of rethinking body.
Do you make people more aware of their inner side?
Yes, it makes people think about how their body is related to their mind. People's personal issues arrive differently.
Do you see BioMapping symptomatic of what is often termed, recently by Charlie Gere, 'real-time digital culture'?
If I think about real time, it is in the context of Henri Lefebvre and the politics of everyday life, and how we experience the space of everyday. I'm quite interested in real time because it applies thinking about the everyday, the quiet and the 'normal'.
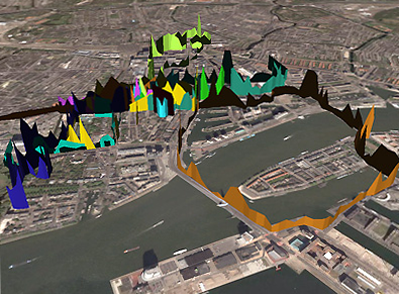
Fig. 3. Rotterdam. Emotion map of a walk with 12 participants. Image © The GeoInformation Group 2006.
The visualisation maps you create, especially since you've started superimposing emotional charts onto Google Earth, are visually stunning. I was drawn into your work because of its aesthetic impact, even before I have found out what BioMapping was about. The jagged 3D structures inserted into urban spaces made me think of Liebeskind's architecture.
Google Earth has this stunning effect. It's almost like a three-dimensional diary drawn across Google Earth. Normally there are no people visible on Google Earth: you can spin across the whole world but you won't see a single one of the two billion people living there, which is quite bizarre. Suddenly with BioMapping, you can see these very detailed tracks of somebody's experience. Visually, it has a certain authority. Maps all have authority and the 3D quality gives this authority to the project. You see a peak and people almost need to talk about this peak; it becomes a discussion point.
The visual representation I chose is important not only for aesthetic reasons. I've chosen maps because they talk lots of languages we are familiar with. For example, we are familiar with the scientific visualisation of the cardiograms. When doctors look at a cardiogram they look for pathology, and try to see what's wrong, looking for the one missing bit. So the idea of BioMapping is of almost a cardiogram put across the landscape. I'm interested how people deal with these mixed languages: the language of maps-which is about power-and the scientific language of cardiograms. I want people to find their own way of negotiating between the two.
Some people refuse to annotate because it is quite a powerful representation. There is almost a sense that everything is mapped out for you, but then through discussions we come back to the point where we can see that these biometric technologies don't tell you everything. They give us some abstract squiggles and these squiggles need some interpretation. Personal interpretation makes it interesting and meaningful.
Going back to your days at the Royal College of Art, what did you do before BioMapping?
I have a fairly traditional art background. Like a lot of people involved in media art in the early 1990s I was doing video art. In the mid-1990s I discovered the Internet, or the Internet discovered me. I got madly involved in doing slightly hacky things with the Internet. Heath Bunting was one of my big inspirations, so were people from Irrational, the Institute of Applied Autonomy, and Natalie Jeremijenko. A lot of these people were really influential in showing how technology wasn't so clean. There is something very irrational and bizarre about technology. These artists were finding really interesting ways of using technology to highlight its bizarre, contradictory aspects.
I found, however, that the Internet as a distribution medium didn't provide enough feedback and discussion. I really wanted to have a real live discussion, so I started applying some of the ideas of Net Art to much more physical, real world things. I was building small protest tools that were designed to be attached to CCTV cameras; beguiling helium balloons drew attention to these cameras and made noise. I was building periscopes that floated in the river and had radio transmitters inside that were knocking out the local radio stations. I guess this physical technology brought me directly towards BioMapping in many ways. In between I also wrote a book called Mobile Vulgus, which got me to think in a particular way about tools and objects, and how objects start to transform our way of dealing with the world. I spent a year interviewing riot policemen, activists, weapon designers and psychologists.
There are some interesting nineteenth-century precedents of mapping social phenomena. John Stow's Survey of London, for example, and police reports from various wards of London
Yes, I love the Charles Booth Poverty Map. I'm fascinated by the nineteenth century. This is when all the interesting technologies were invented, photography and early computing came together. This is where Charlie Gere and Lev Manovich are really good at rethinking the beginning of computing and multimedia.
You also teach.
I teach New Media Histories at the South Bank University, London and I do Electronics Clinics at the Bartlett, Faculty of the Built Environment, which is part of University College, London. We teach architectural students how to deal with interactive environments. They want to walk into a building and their presence to transform the buildings. So they want a bunch of sensors to manipulate motors to move the walls and change lighting levels. There is a lot of thinking going on at the moment about physical computing: the idea that our bodies interact with computers in a very transparent way. Soon we won't be using computers any more. We'll be interacting with stuff'.
It's the opposite of Augmented Reality. It's also a big reaction against the 1980s idea of Virtual Reality. The idea was that the real world suddenly merges into the computer. Now computing is going the other way, it is becoming invisible and ubiquitous. Nobody talks about Virtual Reality any more. The new idea is that computing is in every object we touch. We are not talking about mobile phones any more but Radio Frequency Identification (RFID) tags that can be embedded everywhere. This will be pervasive and invasive computing. We will be using doors that are going to recognise who we are and why we might be trying to open this door. Some will open for us, and some won't.
The Greenwich Map is coming out in three weeks printed by the Ordnance Survey in size A0. It will be interesting to see how people deal with this physical map.
It's a full circle.
I like the idea of maps because people know what to make of them. For communal representation I found that 2D works much better than 3D which often is too powerful and individual. The 3D is useful for an individual who can spin and twist around his view and look at his own immediate environment.
Is there a problem with spatial imagination?
The 3D-view is the view of the ego. When you talk about computer games, it's the ego shooter. The three-dimensional projection shows the individual in the landscape, so it is very useful for individual representation. It becomes very difficult to represent things communally. 2D representation offers more of flat hierarchy.
Do you anthropomorphise landscape?
My project doesn't anthropomorphise landscape, but there are cultural forces that do. People reflect upon them when they talk about landscape. I simply connect two data sources together: the arousal data and the location data.
You map fear, anger, joy and other emotions as part of a landscape.
In the classic representation of Hobbs's Leviathan the community becomes anthropomorphised as the giant. So in that respect, some basic ideas about how we think about community and how we deal with our environment, are really important. People are desperately trying to think what Nature is. We use a lot of metaphors such as parks are the lungs of the city'. People are very keen on anthropomorphising.
In old cosmologies people and their temperaments were very much part of the macrocosm. This worked on different levels: for example devotionally, as being part of the same Church. Hobbs's idea relates to the social and political body whose functioning is determined by the contract of individual citizens with the sovereign. When I look at Antony Gormley's Field for the British Isles, built of tiny figurines, I think about it in this context. Your maps don't show people, yet they are very much present.
I'm thinking about methodologies for representating people and how to discuss these methodologies with people. Is this anthropomorphisation of landscape? Is this an emotional landscape? The anthopomorphism here is about an idea of the embodied being. May be this is as far as I would go. When you think about the body and the landscape, the landscape is nothing without us. Maps which show no people are very bizarre. BioMapping asks how our body relates to the social body, to the physical body of the city. The project deals with ideas of bodies interacting on various levels.
What's the next fantasy project?
A community of people who can share biometric data with each other. There is a new piece of software called Moodstats, built in Denmark, which indicates on the level from 0 to 10 how you're feeling, how much exercise you've done, etc. It's like a little calendar. It's linked across the whole world and people are contributing data to a universal database.
This is exactly what people don't want to do!
The idea is to come up with a global mood. I found it irritating when I tried this on myself, but sharing quite intimate things with our friends and community seems interesting. So I would like to have enough devices to try it, for example on cyclists, and see how a particular community might use it and find their own way of creating communal meaning from the data. On this level I'm still a designer. But I also want to wrap up some of my findings, talk with statisticians to see whether they confirm my data, and write a book. I want to find a way of reflecting on the project and move on.
Brixton, 3 August 2006
© 3DVisA and Christian Nold, 2006.
Back to contents |