|
|

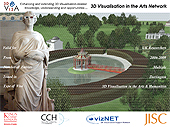
vizNet 2007 workshop
Intersections in Visualization Practices and Techniques
17-19 April Leicestershire, UK
17 April: Half day introduction to what is visualization, how it is applied and examples of current practice in a range of processes. This will be followed by demonstrations of stereoscopic and grid-based visualization and a workshop dinner.
|
Welcome and Introduction to Visualization
|
The first presentation will provide a whistle stop tour of the importance and role of visualization today. It will attempt to demystify some of the science behind visualization and help set the scene for the following more indepth presentations.
|
Prof. Roy Kalawsky (Loughborough University)
|
|
A Rough Guide to Data Visualization Part 1
|
The talk will aim to give a broad overview of the field of data visualization, and will be in two parts. The first part will begin by looking at simple graphs and charts, familiar to all, but with guidance on fundamentals to be understood and pitfalls to be avoided. We then move on to look at visualization of physical data, often called scientific visualization, where we describe the key techniques of isosurfacing and volume rendering. "
|
Prof. Ken Brodlie (University of Leeds)
|
|
Cross-domain: Introduce science/Engineering and Arts/Humanities to how visualization is currently used in their domains
|
This talk will traverse domains by first examining the historical impact of visualisation on western music,
in particular spatial notation and the evolution of polyphony. We then examine contemporary examples with a view articulating new and traditional
research questions for the Arts and Humanities in the visualization problem solving environments of the Sciences and Engineering.
The next part of the session will introduce the surgery session which will be held on the last day of the event (19th April).
This surgery session will be an open workshop to discuss any visualization issues people would like to pose to a panel of experts.
|
Dr. Julie Tolmie
(Kings College London)
Dr. Nijad Al-Najdawi (Loughborough University)
|
|
Demos (Stereoscopic, and Grid visualization)
|
Demos
|
Dr. Martin Turner (University of Manchester)
Mr. John O'Brien (Loughborough University), Mr. Ian Holmes (Loughborough University)
|
18 April: Full day workshop with nine sessions providing introductions to,
and overviews of
|
A Rough Guide to Data Visualization Part 2
|
In the second part of the Rough Guide we discuss visualization of tables of data, that is, tables of observations, each observation comprised of values of a number of variables (as in census data). Here we are looking for relationships amongst the variables, and we discuss scatter plots, parallel coordinates and glyph techniques. Finally we look at visualization of structured data, such as information hierarchies examples of these being computer filestores and web pages.
|
Prof. Ken Brodlie (University of Leeds)
|
|
Mathematical Visualisation in the Sonic, Visual and Performing Arts
|
This talk will examine mathematical visualisation as it is used in the sonic, visual and performing arts. Mathematical visualisation is the generation and/or transformation of data using mathematical structures and mappings. Following on from yesterdays discussion of early polyphony, we begin by providing an historical context for early abstraction in film. We then examine visual programming environments for synchronous composition of sound and image in live performance, in particular the use of Pure Data for physical modelling by French artists, chdh. We then look at a text based environment for visual and responsive structures, Processing, where the emphasis is on interaction rather than synchronous sound and image. We discuss briefly the communities of practice, and give pointers to visual mathematical resources detailing mappings and structures. Time permitting, we focus on the increasing importance of data capture and its (artistic) representation, giving further examples.
|
Dr. Julie Tolmie
(Kings College London)
|
|
Data Acquisition
|
Application of Laser scanning or LiDAR, ground Penetrating Radar and seismic data acquisition technologies and techniques has enabled the 3D visualisation of many facets of the landscape or built environment based on real world measurements. Case studies from the Trent Tame 'Where Rivers Meet' project, North Sea Paleolandscape survey, Restoring the Ancient Stabiae, and San Giovanni in Laterano survey, will look to illustrate the potential of such 3D acquisition and visualisation developments and the way in which they have enhanced the understanding of the subject matter.
|
Dr. Stephen Wilkes (University of Birmingham)
|
|
3D Modelling
|
Fundamental to the 3D visualisation process are the component parts that make up the image, animation or world that is presented to the viewer, of those components the core is the model itself. As we move away from the traditional use of 3D as simple illustrations to becoming research and visual hypothesis themselves the process of creating models must be approached in a different way. This talk will highlight the disparity between the use of 3D models as a purely illustrative technique and their emerging use in cognitive modelling processes. It will further consider the implications of recording the visualisation process and how this paradata can be used to further debate and understating.
The second part of this session will look at 3D modelling and the creation of real-time scenes. Examples will be given of photorealistic 3D modelling of outdoor scenes.
|
Mr. Drew Baker
(King's College London)
Prof. Roy Kalawsky (Loughborough University)
|
|
Display Technologies
|
This session will introduce the different display technologies that are frequentoy encountered by the visualization user. In particular the benefits and disadvantages of each candidate display technology will be discussed.
|
Prof. Roy Kalawsky (Loughborough University)
|
|
Review of Classes of Visualization System: with respect to the options from both open-source and proprietary developers
|
Disparate visualization systems have grown from specific needs and often from either the research or commercial camps; and therefore have to satisfy different purposes and requirements. This short presentation will give a brief show-and-tell of various systems, highlighting some of the differences and advantages of each. There will also be an attempt to class the visualization tools into specific types understandable by software designers. Throughout this presentation there will also be some test comparison studies that will come from alternative fields to the usual scientific and information visualization genres; medical to scientific to mathematical needs, architecture to military to archaeology as well as consider some issues on how they can be exploited for artistic purposes.
|
Dr. Martin Turner (University of Manchester)
|
|
Using game-based visualisation to support exploratory learning approaches with serious games applications
|
The presentation will include an introduction to the Four Dimensional Framework (de Freitas and Oliver, 2006), a framework designed to support designers developing game-based learning more effectively. The presentation will also showcase the first demonstrator emerging from the £2 million UK Department of Trade and Industry's part-funded Serious Games project - the Triage Trainer. The presentation will also include a consideration of some future uses of game-based learning, including alternate reality gaming and mobile gaming, considering their applicability for learning and training.
|
Dr. Sara De Freitas (Birkbeck University)
|
|
Web-based portal delivery visualization
|
Contemporary artists working within the field of New Media have utilised the Internet as creative space for the past decade. Although the majority of Internet Art projects utilise 2D visualisation technologies, advances in consumer-level computer graphics and processing have afforded artists working in the medium the potential to incorporate 3D content into such artworks. This talk will provide an overview of the main code technologies that are currently used by artists (VRML/X3D, Shockwave and Java/Processing) to create 3D artefacts and worlds for the web. It will then consider the emergence of multi-user 3D environments (such as Second Life) and the possibilities for artists to transition isolated, single-user artworks into forms that embrace the notion of virtual public space.
|
Mr. Michael Takeo Macgruder
(King's College London)
|
|
Grid-based visualization
|
Grid-based
visualization
This session will explore what is meant by the Grid and the role that visualization has to play in this. We will seek to outline some of the technical, social and creative benefits and challenges such an approach brings.
|
Prof. Nick Avis
(Cardiff university)
Dr. Gregory Sporton (Birmingham Institute of Art and Design)
|
|
Documentation of a Visualization Project
|
This session will explore how documentation can be used to address significant issues that arise out of the use of visualisation technologies in research contexts, including those of archiving and preserving digital assets and of ensuring intellectual transparency. It will consider some of the challenges and major initiatives regarding the production of metadata (cataloguing information) and paradata (documentation of interpretative processes) appropriate for visualisation projects with particular reference to arts and humanities contexts.
|
Dr. Hugh Denard
(Kings College London) - 3DVisA
|
|
Plenary Discussion: looking for intersections between Scientific/Engineering and Arts/Humanities Visualization
|
This session will be an open plenary discussion looking for intersections in visualization practices and techniques. Questions for surgery workshop to be handed in.
|
Dr. Julie Tolmie
(Kings College London) Session Chair
|
19 April: Full day of expert seminars in specialist areas.
|
Workshop 1 - Visualization Using Commodity Clusters, and Entry level visualization through desktop tools
|
When scalability and amount of data requiring to be transferred for visualization and analysis become bottlenecks, the locality of visualization processing becomes an important factor to support the quality of system response for near real time data analysis. Visualization on and alongside the national computational grid and the technical challenges that are associated with it are hot topics of current research within the visualization community. This presentation will explain our approach and demonstrate some of our visualization services based on commodity cluster with open source software stack. The second part of the workshop will demonstrate and discuss the support provided by a sample of commercial and some non commercial desktop tools with easy interfaces to getting started with visualization.
|
Dr. Lakshmi Sastry, Mr. Srikanth Nagella
( Rutherford Appleton Laboratories)
|
|
Workshop 2 - Commissioning and Managing Interdisciplinary Visualisation Projects
|
This workshop will explore some of the ways in which the different disciplinary backgrounds of artists, scientists, engineers, computer scientists and humanities researchers shape their assumptions about and understanding of the nature and purpose of visualisation technologies and of the relationship between the roles of thinkers and doers. Participants will be invited to discuss how collaborative, interdisciplinary projects can anticipate, stimulate and exploit the evolution of interdisciplinary skills and knowledge bases in the course of a project, including what processes may aid in translating terms and concepts across disciplinary boundaries.
|
Dr. Hugh Denard
(Kings College London) - 3DVisA
Prof. Roy Kalawsky (Loughborough University)
|
|
Workshop 3(a)- Visualization as Interface: Enabling the Construction of Effective Learning Designs
|
The first part of this workshop will investigate the pedagogically effective design of a series of reusable and mobile learning objects.
These objects are designed to enhance the engagement and deepen the learning experience of users through the incorporation of a number of distinct visualization
techniques. An archeological learning environment will be explored from the point of view of its novel approach to using visualization as an interface into
its complex dataset. The subsequent process of data-mining hierarchies of evidence (intellectual transparency) in the quest for constituent parts,
key narratives and evolutions of form will be demonstrated. The methodology for the generation of dynamic visualizations on mobile phones will
also be summarized using a series of sports science learning objects. The second part of this workshop will discuss the usability and accessibility issues
in websites design
|
Mr. Carl Smith
(London Metropolitan University)
|
|
Workshop 3(b)
Websites Usability and Accessibility
|
Websites Usability and Accessibility
|
Dr. Nijad Al-Najdawi
(Loughborough University)
|
|
Workshop 4-
e-Viz API to aid Computational Steering and Visualization
|
e-Viz is an EPSRC project aimed at developing an advanced environment for enabling visual supercomputing; the principle investigator is Prof Nigel John at the University of Wales, Bangor and incorporating researchers at the University of Wales, Swansea, the University of Leeds and the University of Manchester. The focus of the work to be presented is the specific development carried out between the Universities of Manchester and Leeds. This work aims at creating a selection of visualization services using different applications and toolkits, such as VTK, VMD and ParaView. A library and accompanying API has been coded that enables a developer to create an abstract wrapper around visualization applications, providing a steerable interface to different visualization parameters, and dealing with the capture and delivery of remotely rendered visuals. One key feature is that there is a reconfigurable user interface that connects to the abstract visualization wrapper giving the user a common interface to a range of remote visualization services.
|
Mr. Mark Riding
(University of Manchester)
|
|
Workshop 5 - Surgery
|
An open workshop to discuss any visualization issue people want to discuss with a panel of experts
|
vizNET Team
|
Further information on this past event:
VizNET 2007 website.
or email
Dr. Julie Tolmie: julie.tolmie at kcl.ac.uk
Dr. Nijad Al-Najdawi: n.al-najdawi at lboro.ac.uk
|
|