AHRC ICT Methods Network Expert Workshop
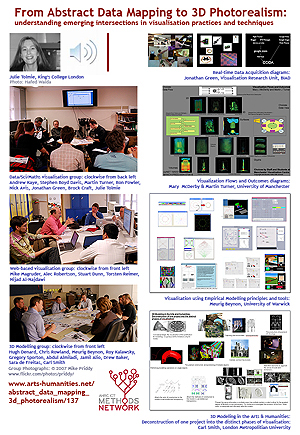
From Abstract Data Mapping to 3D Photorealism:
Understanding Emerging Intersections in Visualization Practices and Techniques
19 June 2007, Birmingham Institute of Art and Design
Researchers in arts and humanities, social sciences, scientific and engineering communities are
generating, and accessing via grid and other networked technologies, ever increasing amounts
of complex data. In turn, the analysis and presentation, or the enabling of real-time
collaboration on such data and its constructed models, relies increasingly on visualisation
techniques and environments. Incremental advances in technology have tended to lead to the
emergence of discipline specific methodologies or dedicated software. This has at times posed
problems of their interoperability or fitness for use by other communities.
This is changing; models and methodologies now tend to span multiple visualisation techniques
and environments. The development of these intersections bodes well for reuse of resources,
training and collaboration in the wider UK visualisation community; however the meaning of
the term visualisation varies widely between different disciplines according to the specific
visualisation practices and techniques employed, and the research questions traditionally posed
by that discipline. Interoperability and strategic approaches to tools development can be
limited by research culture and focus. In addition, in both Science and Engineering and Arts
and Humanities, visualisation can vary from multidimensional abstract datasets (including text
visualisation and sensor data) to three-dimensional virtual reconstruction of natural and built
environments. Providing introductions to, and overviews of, different areas of visualisation to a
cross-domain audience is therefore quite a challenging task.
The vizNET 2007 Workshop successfully began this process. This follow-up expert workshop
brought back together the presenters from vizNET 2007 along with other experts in visualization in
Science & Engineering and Arts & Humanities, firstly to re-present to one another examples of
visualisation in their respective fields, and secondly, to use these examples to draft
cross-domain orientation materials in visualisation topics.
Why the visual format?
While it is impossible by definition to cover all the possibilities in different visualization areas
in such a short space of time, annotated diagrammed examples can provide an excellent
starting point for cross-domain group activity. In particular by juxtaposing diagrams authored
from the viewpoints of different domains, we can assist in the rapid identification of places
where the same term is used differently, or where different terms are traditionally employed
in different domains for the same object or process. This visual format is designed to challenge
researchers to extend their own research questions both into the language of other domains,
and to envisage ways of appropriating the practices and techniques of other domains within
their own research culture and focus, thus establishing a genuine cross-domain dialogue.
Outcomes of the event
Papers from each of the presenters, the group summaries and the workshop report
will shortly be available on the Methods Network website.
The programme of the actual event, including two participant presentations, is listed below. Workshop participants are also listed by group.
Why not join the Methods Network Group for this workshop?
You can register at http://www.arts-humanities.net/abstract_data_mapping_3d_photorealism.
Thank you
A special thank you to Gregory Sporton and the Visualisation Research Unit at the Birmingham School of Art and Design
for hosting this event. Thank you to Mike Priddy for the group photographs and Jonathan Green for the audio files from which Julie Tolmie prepared transcripts for each presenter.
Workshop Programme
Note: with some changes in running order to group similar topics.
Morning: Presentation of diagrams and annotated visual materials
|
Why visualise visualisation for a cross-domain workshop?
Workshop objectives outlined
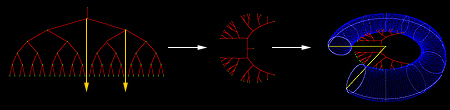
Animated diagrammatic example: Tolmie (2000)
|
Dr Julie Tolmie
King's College London
|
Science and Engineering
|
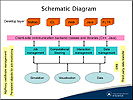
Diagrams of Prof Ken Brodlie
Data Visualisation, Scientific Visualisation
|
Dr Julie Tolmie
King's College London
|
|
Visualization Flows and Outcomes
Dr Mary McDerby, Dr Martin Turner
|
Dr Martin Turner
University of Manchester
|
Arts and Humanities
|
Mathematical Visualisation in the Arts
|
Dr Julie Tolmie
King's College London
|
|
Real-time Data Acquisition
|
Jonathan Green
Birmingham Institute of Art and Design
|
Science and Engineering
|
3D Modelling and Display Technologies
|
Prof Roy Kalawsky
Loughborough University
|
|
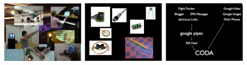
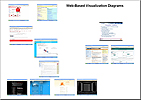
Website Accessibility and Usability
|
Dr Nijad Al-Najdawi
Loughborough University
|
|
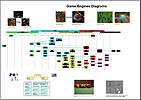
Game Engines
|
Dr Nijad Al-Najdawi
Loughborough University
|
Arts and Humanities
|
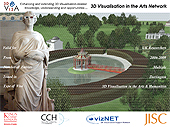
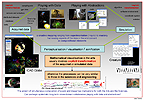
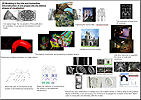
3D Visualisation within Internet Art:
Current Technologies and Practice
![]()
|
Michael Takeo Magruder
King's College London
|
|
3D Modelling in the Arts and Humanities
|
Carl Smith
London Metropolitan University
|
|
3D Modelling, 3D Documentation
|
Drew Baker, Dr Hugh Denard
King's College London
|
Arts and Humanities / Science and Engineering
|
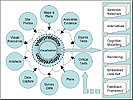
Visualisation, fidelity and the serious game
![]()
|
Dr Sara de Freitas
Serious Games Institute, University of Coventry
|
|
Visualisation using Empirical Modelling
Principles and Tools
|
Dr Meurig Beynon
University of Warwick
|
Arts and Humanities
|
Visualising and Reality
|
Dr Gregory Sporton
Birmingham Institute of Art and Design
|
|
A word about the weather: depiction and visualisation
|
Dr Stephen Boyd Davis
Middlesex University
|
Science and Engineering
|
Grid Visualization
|
Prof Nick Avis
University of Cardiff
|
|
Visualization using Commodity Clusters
|
Dr Andrew Kaye, Dr Ron Fowler
for Dr Lakshmi Sastry
Science and Technology Facilities Council
(Rutherford Appleton Laboratories)
|
Arts and Humanities
|
Humanities, e-Science and Visualisation
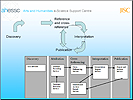
|
Dr Stuart Dunn
King's College London
|